
JSONata in Uptime Kuma
When I wrote a simple metrics reporting utility, I had it output keywords triggered by thresholds so they could be checked for by Uptime Kuma. Here’s some sample output:
{
  "title": "vitals-glimpse",
  "version": 0.6,
  "hostname": "ct350-boinc",
  "mem_status": "mem_fail",
  "mem_percent": 96,
  "disk_status": "disk_okay",
  "disk_percent": 49,
  "cpu_status": "cpu_okay",
  "cpu_percent": 4,
  "disk_iops_status": "disk_iops_okay",
  "disk_iops": 0
}
Uptime Kuma has the ability to check for keywords, so in the case above we might set up a monitor for HTTP(s) Keyword looking for disk_okay. The monitor has an internal threshold, and when the disk_percent goes over it, the disk_status keyword will switch to disk_fail and the Uptime Kima monitor will trigger because it can no longer find the keyword it’s looking for.
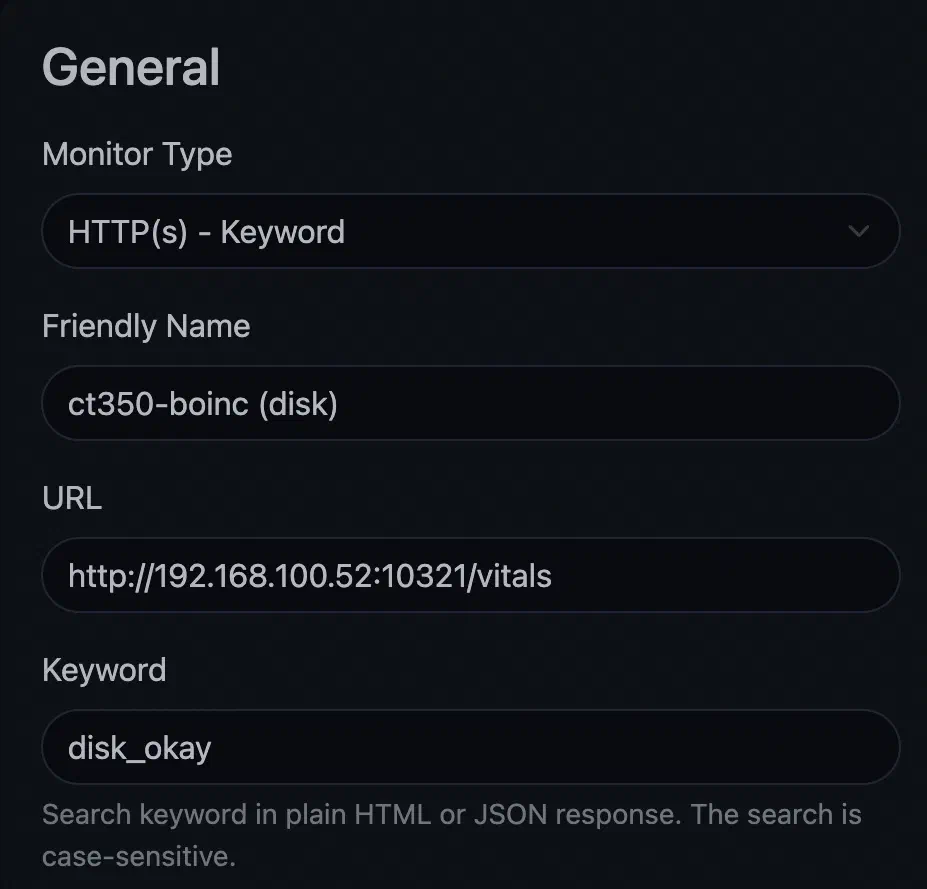
I included the numeric values in the JSON output since it was cheap and helped humans.
The problem
The JSON above is from an LXC running in my homelab. The workload is BOINC (Berkeley Open Infrastructure for Network Computing) which is a SETI@Home type distributed computing model run by World Community Grid. I’m effectively donating a tiny amount of compute to their projects (currently mapping cancer markers or similar). Since most of their workloads require a GPU which I don’t have on this mouse powered server, they don’t send me much work, and often it will be idle for weeks.
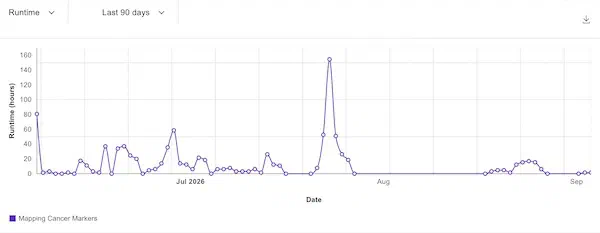
Usually the workloads are very cpu intensive - pinning a core for a few seconds, then dropping back to a fraction of that (I guess while it sends that result), but previously the memory use has been low - around 200MB.
Something must have changed recently, since my 90% memory threshold monitor was triggered. It was reporting 96% used. I doubled the LXC memory from 256MB to 512MB, and it immediately used 96% of that. So I guess this is going to be the new normal, and I should just change my threshold to 97% for this machine.
I don’t actually remember how I run vitals-glimpse on this machine, it’s installed with an Ansible playbook, so probably systemd. I’m too lazy to figure that out and look up my own docs for that and the command line flag to set the threshold. What I’d rather do is some click-ops in Uptime Kuma and get it to read the value and test it against a threshold.
Luckily, since I’ve started using Uptime Kuma, that exact feature has been added - I think in about v1.23. It uses a great library: JSONata. This is query language against a JSON object - Uptime Kuma will fetch the JSON, the apply your JSONata query to it, and test the result of that query against a threshold:
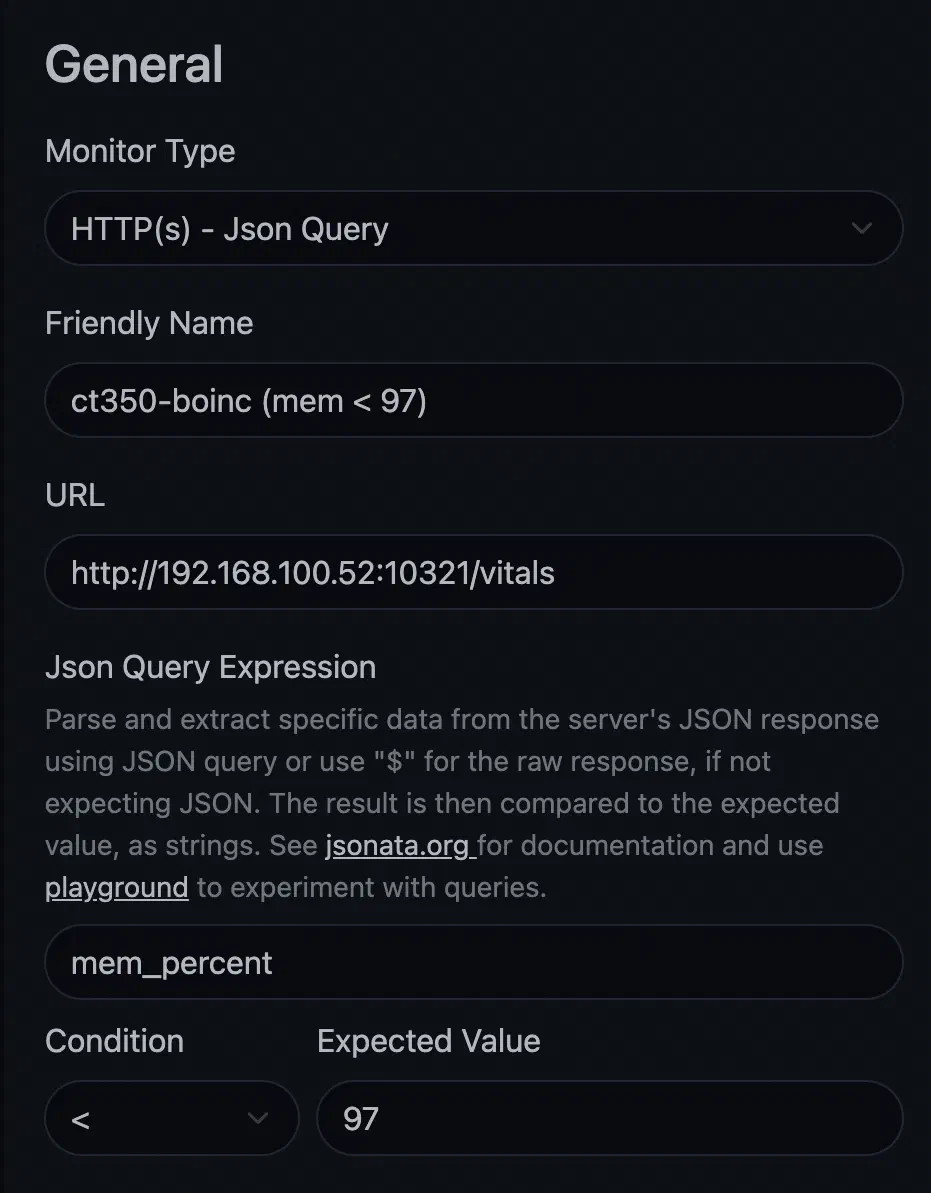
This is a very simple query for JSONata - we could have just as well done something more complicated such as using a memory threshold much lower IF the cpu was low, but allowing it to scale up to 97% if the cpu went over 50%
with:
((cpu_percent<50) and (mem_percent<80)) or ((cpu_percent>49) and (mem_percent<96))
then I’d test that against == true
JSONata deals neatly with arrays and nesting, so you can imagine the queries start to get complicated looking. To test your logic the author, Andrew Coleman, has a JSONata Exerciser where you can paste some JSON and try queries against it. Andrew also has a video with clear explanations to get you going.