
Detecting front-end client errors
Problem
One of my sites had a problem last week that wasn’t picked up by my monitoring. Uptime Kuma checks the site every three minutes looking for a keyword in the HTML to ensure it’s up, but it wasn’t noticing that the weather (fetched from elsewhere) in the corner of the page wasn’t being updated. The page, and the server providing, it were all working perfectly and Uptime Kuma was correctly reporting that, but there was an error being triggered in the Javascript on the page.
It’s not possible to monitor that directly with Kuma - it’s accessing the page effectively without Javascript, so the weather is never filled out when it sees it, so it can;t be checked.
If I visited the site in a browser with the dev tools open there were error messages in the console - the page fetches some JSON from one of my endpoints on another domain, and that was failing (I’d changed the reverse proxy for all the services on that domain, and not done a permissive CORS header for this one).
So that’s the situation I needed to address - A site is having front end errors logged, but I wasn’t being alerted.
Sentry
There’s a number of commercial products that do exactly this sort of monitoring. You add a script tag in your page to their js bundle, then when you log into their monitoring tool there’s all sorts of interesting data, including errors from your clients that would normally disappear into the browser console log. Sentry have a generous free tier so it’s hard to argue with, and would have fixed my issue.
Solution
I generally prefer small simple focused solutions that I have control of, so I won’t be installing a commercial product. All I need is to know for each site is if there are any front-end errors, and to have that available in some way.
We’re going to need to:
- capture any errors in our front end Javascript
- send them to a server somewhere
- have that server expose them as a keyword for Uptime Kuma
Error detection in browser JS
This is not that hard. The browser has a couple of events that can expose uncaught errors we might be interested in. We just need to add listeners to the window object for them.
window.addEventListener('error', function (e) {
    report(e.message, e.filename);
});

window.addEventListener('unhandledrejection', function (e) {
    report(String(e.reason), location.href);
});
- error - for regular errors, we report the error message and the file it occurred in
- unhandledrejection - promise failures are a bit different and have their own event. The filename is not reliably included so we report the current page URL instead.
These two events are going to pick up the unhandled issues, but most of the time we will have programmed defensively and caught the possible errors and the console log is our message. There’s no good way of hijacking all of those, but we can at least give the front-end dev a way of manually report things to our error collection server.
window.faultsy = {
    report: function (err) {
        report(err instanceof Error ? err.message : String(err));
    }
};
Now, whenever I need to report to the system in my error handler, I can just:
window.faultsy.report('Demo manual report');
And the report is sent to the server along with the unhandled errors.
Reporting
The report function just needs to send it to our server:
function report(message, url) {
    navigator.sendBeacon(SERVER_URL + '/errors', JSON.stringify({
        site: location.hostname,
        message: message,
        url: url || location.href,
        ts: new Date().toISOString()
    }));
}
We use sendBeacon() rather than fetch() because it’s designed for this type of metrics dispatch and will push through some situations that fetch() won’t - like the page unloading.
We can put all of this into a .js file and send it from the error collection server:
(function () {
  var SERVER_URL = 'https://faultsy.example.com';
  function report(message, url) {
    navigator.sendBeacon(SERVER_URL + '/errors', JSON.stringify({
      site: location.hostname,
      message: message,
      url: url || location.href,
      ts: new Date().toISOString()
    }));
  }
  window.addEventListener('error', function (e) {
    report(e.message, e.filename);
  });
  window.addEventListener('unhandledrejection', function (e) {
    report(String(e.reason), location.href);
  });
  window.faultsy = {
    report: function (err) {
      report(err instanceof Error ? err.message : String(err));
    }
  };
})();
Any site wanting to use this, just needs to add it in a script tag linking to their monitoring installation since the server software (a node program) serves it up with it’s own URL inserted.
  <title>Faultsy Demo</title>
  <script src="https://faultsy.example.com/faultsy.js"></script>
Server
When the sendBeacon is triggered, it is a POST to /errors. We have to convert the string blob back to JSON (using a string with sendBeacon() sends it as text/plain which avoids a CORS preflight), then extract the fields and save the result.
app.post('/errors', express.json(), express.text({ type: 'text/plain' }), (req, res) => {

  // extract the hostname if it's a valid URL
  const origin = req.headers['origin'];
  let hostname;
  try {
    hostname = new URL(origin).hostname;
  } catch {
    logger.warn('Error POST rejected – invalid Origin header');
    return res.sendStatus(403);
  }

  // extract the error from the request if it's valid
  let body = req.body;
  if (typeof body === 'string') {
    try { body = JSON.parse(body); } catch {
      logger.warn('Error POST rejected – invalid JSON body from %s', hostname);
      return res.sendStatus(400);
    }
  }
  const { message, url } = body ?? {};
  if (typeof message !== 'string' || message.length === 0 || message.length > MAX_MESSAGE) {
    logger.warn('Error POST rejected – invalid payload from %s', hostname);
    return res.sendStatus(400);
  }

  // save the error
  dbInsertError(hostname, message, url);

  logger.debug('Error recorded for %s', hostname);
  res.sendStatus(204);
});
In practice it’s a tiny bit more complex, before we do the above, we’ll need to:
- set CORS headers
- do some security checking
Monitoring
We end up with a database of time stamped errors for each site. The /results endpoint just returns these as JSON with the site names and number of faults in the last 24 hours:
{
  "127.0.0.1": 11,
  "example.com":0,
  "otherwebsite.com":0
}
The in Uptime Kuma, we set up a monitor that looks for the site name in the JSON with zero errors:
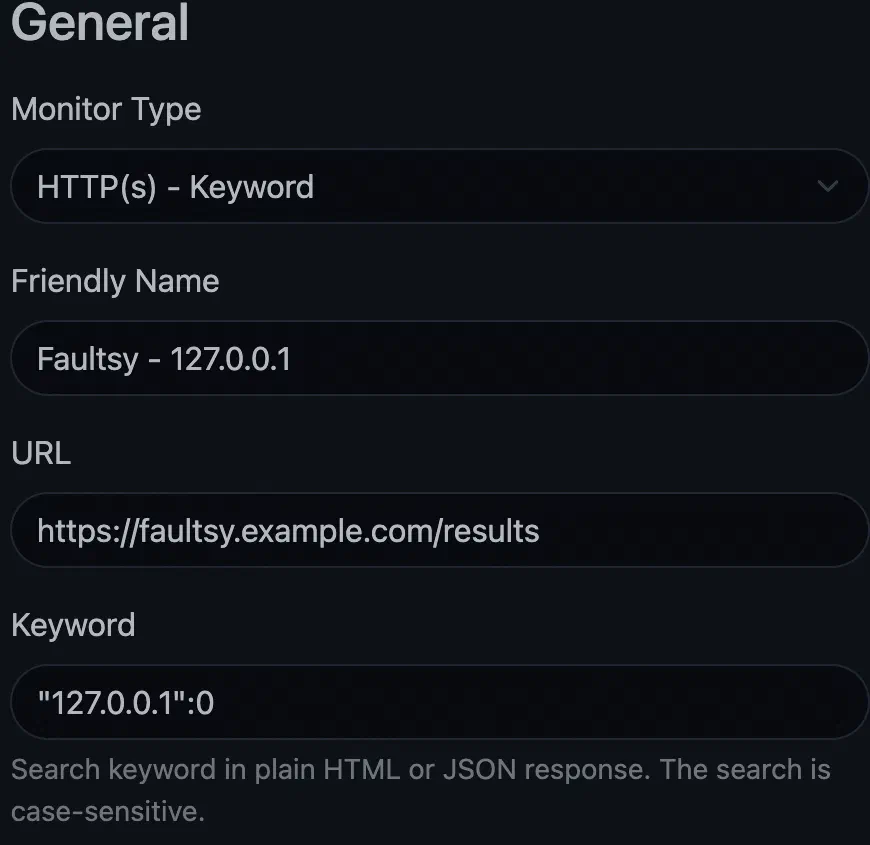
Now, if there are errors in my front end code, I’ll be notified immediately.
As of the time of writing, this project is under active development & testing, but it’s available here.